Geologic mapping and geological assessments in the Western U.S., bedrock and surficial, any scale
Introduction. Making geologic maps is the first step in understanding the geology of an area and in solving geologic problems of any sort. Is my home susceptible to landsliding, flooding, or an earthquake? Does that mining district contain any more gold? Where does my city drill for water, my company drill for oil? Where do I find nearby aggregate for a road? Do these rocks contain dinosaur fossils? Is that valley a good place to site a county landfill? Why does my well produce half as much water as it did two years ago? Is that a good spot to put a dam? The answers to these and many other questions about the land we live on are provided by geologic maps (the image below) and geologists who interpret them. Population growth requires more and more land-use decisions in an area. Digital geologic maps are the most practical tool a geologist or hydrogeologist can use to address land-use questions and, when the maps are peer-reviewed and published, they provide objective, unbiased data available to the entire Public, not just the funding agency. Most published digital geologic maps have been traditionally provided by State and Federal agencies. Yet as tax money has been shifted to national defense, social security, or other topics at the political forefront, the numbers of government scientists are shrinking. Geological consultants experienced in making and publishing geologic maps are increasingly being directed into high-growth areas containing geologic or environmental hazards or water-supply problems. A primary funding source for making regional (mostly 1:100,000- to 1:24,000-scale) quadrangle maps is the nationally-funded Statemap Program, managed by the U.S. Geological Survey (USGS) and providing mapping grants to States by an application process. Of course, not all maps need to be published, but they must be objective and unbiased. Quasi-governmental agencies such as water districts or private organizations such as mining companies are sources for funding many other geologic maps.
Colorado. Geologic Mapping, Inc. has provided the lead for (senior authorship) and assistance with (junior authorship) many published geologic maps. These include, during part-time employment with the Colorado Geological Survey (CGS) in 2001-2003, senior authorship of the 1:24,000-scale digital Cheyenne Mountain 7.5-minute quadrangle (an area of about 60 square miles) and junior authorship of the Cascade quadrangle, near Pikes Peak (one of several photos in upper right) and Colorado Springs; both published in 2004.
Southwest Utah. Another senior authorship is the geologic map of the 1:100,000-scale digital Cedar City 30 x 60 quadrangle (an area of about 2000 square miles), southwest Utah, for the Utah Geological Survey (UGS), published in preliminary form in 2006 after we worked several years under contract with UGS. It shows the Iron Springs mining district, the Hurricane fault zone, and areas of urbanization that are potentially subject to geologic hazards and decreasing water supplies. An additional senior authorship, done also under contract with the UGS, is the Beaver 1:100,000-scale digital quadrangle. Among its uses was that it covers most of the Marysvale volcanic field, which contains many mining districts and Utahs two largest geothermal-energy power plants. A preliminary version was open filed in 2005. Within its boundaries are the Cave Canyon and Adamsville 1:24,000 quadrangles, which contains two former mining districts, and is continuing to be mapped under funding from Robert E. McDonald of California. A photo in the upper right looks north past burned trees into the central Mineral Mountains, where Utahs largest batholith (white granite) is overlain in the distance by rounded young tree-covered volcanic domes and lava flows of obsidian that were mined and traded by ancestral Indians for points (see Lipman and others, 1978, in Publications). The magma source for these rhyolite domes and flows exists at depth, providing the heat for Utahs largest geothermal plant (Roosevelt). Curiously, our mapping of the Beaver 30 x 60 quadrangle, most of it done while with the USGS, failed to notice three giant old (Miocene) gravity slidesthe largest landslide complex on the Earths land surface. These slides were discovered in 2012-2019 by Bob Biek of UGS, Dave Hacker of Kent State University, and me. That story will be told below, for the discovery demonstrates the need to geologically map the same areas periodically, inasmuch as science advances when new knowledge and new eyes make previous work partly or wholly obsolete.
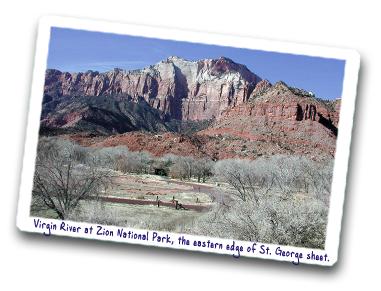
St. George quadrangle. The St. George 30 x 60 quadrangle, south of the Cedar City quadrangle, forms the southwest corner of Utah, mostly Washington County. It and the Panguitch 30 x 60 quadrangle, east of the Cedar City quadrangle, were senior authored by Bob Biek, and Geologic Mapping Inc. was contracted in 2006-2007 to help with the former one. After the Great Recession of 2008-2009, population growth in the St. George area surpassed that of Las Vegas in being the fastest-growing city in the U.S. This photo looks north across the Virgin River at Zion National Park, at the east edge of the St. George sheet, showing the Springdale landslide above the trees at the base of cliffs of the Jurassic-age Moenave Formation and the overlying Navajo Sandstone. This landslide was triggered by the 1992 magnitude-5.8 St. George earthquake along the Hurricane fault, the largest earthquake in Utah since 1975. Most of my mapping for the St. George project involved mapping at 1:24,000 the Goldstrike quadrangle and Utah part of the Docs Pass quadrangle to the Nevada State line, published in 2007. The map area contains the recently reclaimed open pits and underground mines of the Goldstrike gold district, with potential for more gold. The photo looks southeast across the canyon of Beaver Dam Wash toward a string of open pits, from left to right in the near background, that are controlled by a WNW oblique-slip fault zone. The final St. George quadrangle was published in 2009.
The Worlds largest terrestrial landslide. After Bob Biek finished the St. George quadrangle, he began mapping the Panguitch quadrangle. This sheet contains the northern extension of the large active Hurricane fault, Cedar Breaks National Monument, and most of Bryce Canyon National Park. Previous mapping by Professor John Anderson and his graduate students at Kent State University had discovered an old (Miocene, with movement at 23 Ma) landslide capping the highest parts of the Markagunt Plateau, including Brian Head ski resort (elevation 11,000 feet; Rowley and others, 2013). As Bob mapped areas not visited before, the landslide grew in size, to 1350 mi2, therefore much larger than the 200 mi2 estimated by John in 1993. Dave Hacker, then others, discovered thin veins of pseudotachylyte, a glass caused by frictional melting of dry rock when involved in catastrophic landsliding. Some parts of the slide are a tectonic breccia (photo with hammer for scale) but most of it, especially in its northern parts, consists of blocks thousands of feet thick. Called the Markagunt gravity slide and larger than Rhode Island, Bob and Dave began writing reports about it (Biek and others, 2014; Hacker and others, 2014, 2017), then the final release of the Panguitch quadrangle (Biek and others, 2015). This view east shows Bob Biek (on right) and Dave Hacker (left) at the horizontal basal leading edge/shear zone (left and right of the brim of Daves hat) of the Markagunt gravity slide on the south side of Haycock Mountain. Deformed (shattered) 27-Ma red Isom ash-flow tuff has overridden, left to right, undeformed gray stream conglomerate of about 23 Ma. Then Bob and Dave found another, the Sevier gravity slide, to the east (800 mi2, age 25 Ma). Bob proposed to the Geological Society of America a 6-day (September 2017) field conference, called a Thompson Field Forum, for 27 geologic landslide experts to visit the two slides (Biek and others, 2016, 2017). This resulted in a summary report, published as GSA Field Guide 56 (Biek and others, 2019). Then we discovered a third parallel slide, the Black Mountains gravity slide (850 mi2, age younger than 19.5 Ma) that made up the western part of the Markagunt slide and extended farther west. In a view west across I-15, we see the eastern range-front basin-range fault (along the edge of the trees) of the eastern Black Mountains. This 2300-foot-high mass of the Black Mountains gravity slide moved southward (right to left) and largely intact (before basin-range faulting, of course). A gently west-dipping upper shear of the gravity slide shear zone is at the base of the bald hills just west of the scarp, but the main part of the shear zone is at depth. All told, we have 3 side-by-side gravity slides that are younger from east to west, the Marysvale gravity slide complex covering 3000 mi2, that represented three southward-moving catastrophic failures of the southern Marysvale volcanic field while it was still erupting. The 30 x 60 quadrangle north of the Panguitch sheet is the Beaver quadrangle; we soon found that it contains the breakaways for all three gravity slides. The view south of Dawna Ferris and Oreo is at about 10,500 feet elevation in the Tushar Mountains about a mile south of the breakaway, with the southern Tushar Mountains in the near distance and the Markagunt Plateau in the far distance, all within the Markagunt slide. Facilities, roads, and condos of the Mt. Holly ski area make up the left middle-ground. The revised quadrangle map is being released as four quarters at 1:50,000 scale (Rowley and others, 2019, 2020), with another in press and the last to be next year.
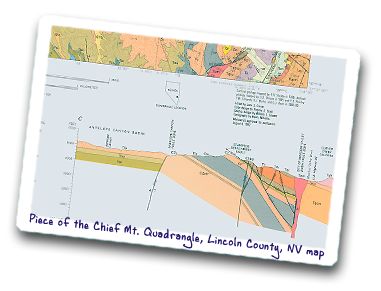
Other geologic maps. Geologic Mapping Inc. has made many other geologic maps, many supported by the Utah Geological Survey. In order to extend the Cedar City 30 x 60 quadrangle westward to the Nevada border, we mapped at 1:24,000 scale a 2.5-mile-wide strip of Utah (Rowley and others, 2008). The strip contains several mining districts, including the late-1800s Stateline gold district, plus five calderas. In order to aid exploration of the geothermal resource at the Sulphurdale geothermal area, we received a grant from UGS to map a 14-square-mile area at 1:12,000 scale south of Cove Fort, on the northwest flank of the Tushar Mountains. A small (4 KW) geothermal plant was already on the property but it was soon torn down and replaced by Enel North America with a larger (25 KW) plant using binary technology. The report, map, and cross sections (Rowley and others, 2013) proposed that the heat source was rhyolite magma at depth. In 2001, my geologic map of the area of the damsite of Piute Reservoir, within a State park, and my assistance to David Simon, of Simon Bymaster of Bountiful, in trenching an active fault that underlies the damsite, provided evidence to the State to move the dam off the fault. Nothing more than simple knowledge of volcanic rocks identified a mine in the glass base of a rhyolite lava flow used by ancestral Indians on BLM land in Lincoln County, Nevada; a short report in 2002 on this newly found archeological site, the source, perhaps for thousands of years, for obsidian points and implements that have been found in other sites in Nevada. Our dog Breccia sits in debitage (waste products from the mining and reworking) that stretches for more than 50 feet in all directions from her.
Dave Simon and I contracted for David Black, another engineering geologist, of Rosenberg Associates, St. George, to analyze a 1000-acre property in Washington, an eastern suburb of St. George. The property belonged to SITLA (State Institutional Trust Lands of Utah), under consideration for sale to a housing developer. But it lay astride the Washington fault, a large north-trending basin-range fault that displaced (about 20 feet) Pleistocene fan deposits just to the south, across Interstate 15, within an old development. Our detailed (1 inch equals 250 feet) geologic map of the property, with its many faults and the likelihood that the fault zone might be Holocene (thus active) was enough to scare away SITLA in 2008 before we started the next phase, which would have been trenches across the fault zone. A photo looks north along the fault where it is within the Navajo Sandstone; our dogs Graben and Breccia are on the west downthrown side of the fault scarp. Shortly thereafter, the three of us teamed up again supported by 2009 stimulus money from the Obama administration that enabled construction of the Southern Parkway, a 4-lane beltway around metropolitan St. George. The engineering plan showed that the beltway and one of the interchanges crossed the Washington fault zone. I was funded to do the geologic map (1 inch = 500 feet) and the two Daves did 14 trenches that demonstrated that the Washington fault was indeed active. The highway was engineered for the fault, and the story was published (Simon and others, 2015).
Mapping for Utah groundwater resources. In 2004, we completed a 1:12,000-scale digital geologic map of a 35-square-mile area containing the newly constructed Sand Hollow Reservoir (see photo) and well field. The study was done for the Washington County Water Conservancy District (WCWCD), St. George. This state water district built the reservoir (now a State park) and owns the well field surrounding the reservoir. The reservoir provides artificial recharge to the red Navajo Sandstone aquifer, the source of most of the drinking water in Washington County, the fastest growing county in Utah. Reservoir water seeps into the aquifer and recharges it. We sited a series of production wells on fault zones that our mapping identified. The first they drilled, in 2006, was pump-tested at 2500 gallons per minute. Collaborators included geologist Gary Dixon and hydrologists Frank DAgnese and Grady OBrien, former colleagues at the USGS and now with their own consulting firms. WCWCD published our maps and report in their own publication series. Such was also the case in 2010 when we published a report and a geologic map (1 inch = 500 feet) of a 6-square-mile area for another artificial-recharge reservoir sitting on the Navajo, the Anderson Junction Reservoir along the I-15 corridor halfway between Cedar City and St. George. We also sited a well field there, although the project has yet to be completed.
Mapping of groundwater flow systems in Nevada. We prepared reconnaissance-scale digital geologic maps and reports that provide the geologic framework for entire ground-water flow systems. One such map is a 1:250,000-scale digital geologic map of an 8,000-square-mile area making up the southern White River regional ground-water flow system of Lincoln and Clark Counties, Nevada, and adjacent parts of Utah and Arizona. The map (Page and others, 2005) contained new mapping by the authors while with the USGS as well as existing mapping that we compiled. It was published by the Nevada Bureau of Mines & Geology under funding by the Southern Nevada Water Authority (SNWA)/Las Vegas Valley Water District (LVVWD), the National Park Service, and the U.S. Fish and Wildlife Service. Such a geologic framework is necessary to construct ground-water flow models and other hydrologic maps by these funding agencies, to apply for water rights from the Nevada State Engineer, and to site production well fields. This was part of a collaboration with SNWA that lasted more than 20 years, beginning while Gary Dixon, I, and others were with the USGS and continuing as consultants until 2017. After 2003, as Las Vegas grew rapidly and its water supply (mostly from Lake Mead) grew more precarious, our mapping expanded northward to embrace the entire White River flow system and parts of adjacent flow systems, making up all of White Pine and Lincoln Counties and parts of Eureka, Nye, Elko, and Clark Counties, Nevada, and western parts of the adjacent counties in Utah (about 40,000 square miles). Most of this area was compiled from previously published geologic maps that we updated and interpreted to account for all available data. We prepared a 1:250,000-scale digital geologic map and many cross sections (example of cross section given below). A hydrogeologic map and sections, in which rock units are lumped together into either aquifers or confining units, were also prepared. These plus a preliminary report that described the geology and hydrogeology of the area, eventually encompassing about 25,000 square miles, were published by SNWA (Dixon and others, 2007). These also allowed the Bureau of Land Management (BLM) to prepare a large Environmental Impact Statement (EIS) for a water pipeline to carry groundwater to Las Vegas. Our mapping pushed farther into Utah to include the southern half of the Great Salt Lake Desert ground-water flow system, an area of 6,500 square miles (Rowley and others, 2009). A final report, with maps and sections, for the 25,000-square mile area of Nevada and Utah was published by the Nevada Bureau of Mines & Geology (Rowley and others, 2017).
Final thoughts. We have expertise in making geologic maps at all scales, from 1 inch = 250 feet to 1:500,000 scale, the latter a huge wall map showing much of the unexplored territory we mapped in Antarctica (Rowley and others, 1992). We received the Dibblee Medal, a national award given annually for career accomplishments in geologic mapping and field geology, in 1995. We have several other awards, and a large bibliography that includes many maps.
Designed and programmed by